


Which countries have the best, and worst, living standards? (economist.com)
Which Countries Have the Best, & Worst, Living Standards?
Data show progress worldwide may have suffered a permanent setback
March 13, 2024 - The 2020s have brought a degree of chaos not seen in decades. A pandemic was followed by a full-scale war in Europe; both sent food and fuel prices surging. Extreme weather events have shown that climate change is beginning to bite. The phrase “unprecedented times” soon sounded worn and vacuous.
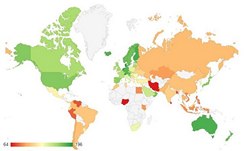
This all took a toll on global standards of living. One measure of this, the un’s Human Development Index (hdi), fell in 2020 for the first time since its launch in 1990. It fell again in 2021. The hdi is one of the most widely used measures of countries’ development, after gdp. It gauges progress in terms of societal outcomes, including life expectancy at birth, expected and average years of schooling and gross national income per person. The latest figures, released on March 13th, show that the global hdi is rising again, but progress has been slow and uneven. Our table below shows how the 194 countries tracked by the un compare.
Which countries have the best, and worst, living standards?
Human Development Index, 2022
|
Index score, |
Life expectancy |
Expected years |
Gross national income per person, $* |
|
|
1 Switzerland |
0.97 |
84.3 |
16.6 |
69,433 |
|
2 Norway |
0.97 |
83.4 |
18.6 |
69,190 |
|
3 Iceland |
0.96 |
82.8 |
19.1 |
54,688 |
|
4 Hong Kong |
0.96 |
84.3 |
17.8 |
62,486 |
|
5 Denmark |
0.95 |
81.9 |
18.8 |
62,019 |
|
5 Sweden |
0.95 |
83.5 |
19.0 |
56,996 |
|
7 Germany |
0.95 |
81.0 |
17.3 |
55,340 |
|
7 Ireland |
0.95 |
82.7 |
19.1 |
87,468 |
|
9 Singapore |
0.95 |
84.1 |
16.9 |
88,761 |
|
10 Australia |
0.95 |
83.6 |
21.1 |
49,257 |
|
10 Netherlands |
0.95 |
82.5 |
18.6 |
57,278 |
|
12 Belgium |
0.94 |
82.3 |
18.9 |
53,644 |
|
12 Finland |
0.94 |
82.4 |
19.2 |
49,522 |
|
12 Liechtenstein |
0.94 |
84.7 |
15.5 |
146,673 |
|
15 Britain |
0.94 |
82.2 |
17.6 |
46,624 |
|
16 New Zealand |
0.94 |
83.0 |
19.7 |
43,665 |
|
17 United Arab Emirates |
0.94 |
79.2 |
17.2 |
74,104 |
|
18 Canada |
0.94 |
82.8 |
16.0 |
48,444 |
|
19 South Korea |
0.93 |
84.0 |
16.5 |
46,026 |
|
20 Luxembourg |
0.93 |
82.6 |
14.2 |
78,554 |
|
20 United States |
0.93 |
78.2 |
16.4 |
65,565 |
|
22 Austria |
0.93 |
82.4 |
16.4 |
56,530 |
|
22 Slovenia |
0.93 |
82.1 |
17.4 |
41,587 |
|
24 Japan |
0.92 |
84.8 |
15.5 |
43,644 |
|
25 Israel |
0.92 |
82.6 |
15.0 |
43,588 |
|
25 Malta |
0.92 |
83.7 |
15.9 |
44,464 |
|
27 Spain |
0.91 |
83.9 |
17.8 |
40,043 |
|
28 France |
0.91 |
83.2 |
16.0 |
47,379 |
|
29 Cyprus |
0.91 |
81.9 |
16.2 |
40,137 |
|
30 Italy |
0.91 |
84.1 |
16.7 |
44,284 |
|
31 Estonia |
0.90 |
79.2 |
15.9 |
37,152 |
|
32 Czechia |
0.90 |
78.1 |
16.3 |
39,945 |
|
33 Greece |
0.89 |
80.6 |
20.0 |
31,382 |
|
34 Bahrain |
0.89 |
79.2 |
16.3 |
48,731 |
|
35 Andorra |
0.88 |
83.6 |
12.8 |
54,233 |
|
36 Poland |
0.88 |
77.0 |
15.9 |
35,151 |
|
37 Latvia |
0.88 |
75.9 |
16.6 |
32,083 |
|
37 Lithuania |
0.88 |
74.3 |
16.4 |
38,131 |
|
39 Croatia |
0.88 |
79.2 |
15.6 |
34,324 |
|
40 Qatar |
0.88 |
81.6 |
13.3 |
95,944 |
|
40 Saudi Arabia |
0.88 |
77.9 |
15.2 |
50,620 |
|
42 Portugal |
0.87 |
82.2 |
16.8 |
35,315 |
|
43 San Marino |
0.87 |
83.4 |
12.4 |
57,687 |
|
44 Chile |
0.86 |
79.5 |
16.8 |
24,431 |
|
45 Slovakia |
0.85 |
75.3 |
14.7 |
32,171 |
|
45 Turkey |
0.85 |
78.5 |
19.7 |
32,834 |
|
47 Hungary |
0.85 |
75.0 |
15.1 |
34,196 |
|
48 Argentina |
0.85 |
76.1 |
19.0 |
22,048 |
|
49 Kuwait |
0.85 |
80.3 |
15.7 |
56,729 |
|
50 Montenegro |
0.84 |
76.8 |
15.1 |
22,513 |
|
51 Saint Kitts and Nevis |
0.84 |
72.0 |
18.4 |
28,442 |
|
52 Uruguay |
0.83 |
78.0 |
17.4 |
22,207 |
|
53 Romania |
0.83 |
74.1 |
14.5 |
31,641 |
|
54 Antigua and Barbuda |
0.83 |
79.2 |
15.5 |
18,784 |
|
55 Brunei |
0.82 |
74.6 |
13.7 |
59,246 |
|
56 Russia |
0.82 |
70.1 |
15.7 |
26,992 |
|
57 Bahamas |
0.82 |
74.4 |
11.9 |
32,535 |
|
57 Panama |
0.82 |
76.8 |
13.2 |
32,029 |
|
59 Oman |
0.82 |
73.9 |
13.0 |
32,967 |
|
60 Georgia |
0.81 |
71.6 |
16.7 |
15,952 |
|
60 Trinidad and Tobago |
0.81 |
74.7 |
14.1 |
22,473 |
|
62 Barbados |
0.81 |
77.7 |
16.5 |
14,810 |
|
63 Malaysia |
0.81 |
76.3 |
12.9 |
27,295 |
|
64 Costa Rica |
0.81 |
77.3 |
16.1 |
20,248 |
|
65 Serbia |
0.81 |
74.1 |
14.5 |
19,494 |
|
66 Thailand |
0.80 |
79.7 |
15.6 |
16,887 |
|
67 Kazakhstan |
0.80 |
69.5 |
14.8 |
22,587 |
|
67 Seychelles |
0.80 |
71.7 |
13.9 |
28,386 |
|
69 Belarus |
0.80 |
73.2 |
14.0 |
18,425 |
|
70 Bulgaria |
0.80 |
71.5 |
13.9 |
25,921 |
|
71 Palau |
0.80 |
65.4 |
17.2 |
19,344 |
|
72 Mauritius |
0.80 |
74.0 |
14.6 |
23,252 |
|
73 Grenada |
0.79 |
75.3 |
16.6 |
13,593 |
|
74 Albania |
0.79 |
76.8 |
14.5 |
15,293 |
|
75 China |
0.79 |
78.6 |
15.2 |
18,025 |
|
76 Armenia |
0.79 |
73.4 |
14.4 |
15,388 |
|
77 Mexico |
0.78 |
74.8 |
14.5 |
19,138 |
|
78 Iran |
0.78 |
74.6 |
14.1 |
14,770 |
|
78 Sri Lanka |
0.78 |
76.6 |
13.6 |
11,899 |
|
80 Bosnia |
0.78 |
75.3 |
13.3 |
16,571 |
|
81 Saint Vincent and the Grenadines |
0.77 |
69.0 |
16.3 |
14,049 |
|
82 Dominican Republic |
0.77 |
74.2 |
13.6 |
18,653 |
|
83 Ecuador |
0.77 |
77.9 |
14.9 |
10,693 |
|
83 North Macedonia |
0.77 |
73.9 |
13.0 |
16,396 |
|
85 Cuba |
0.76 |
78.2 |
14.5 |
7,953 |
|
86 Moldova |
0.76 |
68.6 |
14.9 |
12,964 |
|
87 Maldives |
0.76 |
80.8 |
12.2 |
18,847 |
|
87 Peru |
0.76 |
73.4 |
14.8 |
11,916 |
|
89 Azerbaijan |
0.76 |
73.5 |
12.7 |
15,018 |
|
89 Brazil |
0.76 |
73.4 |
15.6 |
14,616 |
|
91 Colombia |
0.76 |
73.7 |
14.4 |
15,014 |
|
92 Libya |
0.75 |
72.2 |
14.0 |
19,752 |
|
93 Algeria |
0.74 |
77.1 |
15.5 |
10,978 |
|
94 Turkmenistan |
0.74 |
69.4 |
13.2 |
12,860 |
|
95 Guyana |
0.74 |
66.0 |
13.0 |
35,783 |
|
96 Mongolia |
0.74 |
72.7 |
14.5 |
10,351 |
|
97 Dominica |
0.74 |
73.0 |
13.6 |
12,468 |
|
98 Tonga |
0.74 |
71.3 |
16.3 |
6,360 |
|
99 Jordan |
0.74 |
74.2 |
12.6 |
9,295 |
|
100 Ukraine |
0.73 |
68.6 |
13.3 |
11,416 |
|
101 Tunisia |
0.73 |
74.3 |
14.6 |
10,297 |
|
102 Marshall Islands |
0.73 |
65.1 |
16.4 |
6,855 |
|
102 Paraguay |
0.73 |
70.5 |
13.9 |
13,161 |
|
104 Fiji |
0.73 |
68.3 |
13.8 |
11,234 |
|
105 Egypt |
0.73 |
70.2 |
12.9 |
12,361 |
|
106 Uzbekistan |
0.73 |
71.7 |
12.0 |
8,056 |
|
107 Vietnam |
0.73 |
74.6 |
13.1 |
10,814 |
|
108 Saint Lucia |
0.72 |
71.3 |
12.7 |
14,778 |
|
109 Lebanon |
0.72 |
74.4 |
12.1 |
12,313 |
|
110 South Africa |
0.72 |
61.5 |
14.3 |
13,186 |
|
111 Palestinian Territories |
0.72 |
73.4 |
13.2 |
6,936 |
|
112 Indonesia |
0.71 |
68.3 |
14.0 |
12,046 |
|
113 Philippines |
0.71 |
72.2 |
12.8 |
9,059 |
|
114 Botswana |
0.71 |
65.9 |
11.4 |
14,842 |
|
115 Jamaica |
0.71 |
70.6 |
12.5 |
9,695 |
|
116 Samoa |
0.70 |
72.6 |
12.4 |
4,970 |
|
117 Kyrgyzstan |
0.70 |
70.5 |
13.0 |
4,782 |
|
118 Belize |
0.70 |
71.0 |
12.4 |
9,242 |
|
119 Venezuela |
0.70 |
71.1 |
13.5 |
6,184 |
|
120 Bolivia |
0.70 |
64.9 |
15.0 |
7,988 |
|
120 Morocco |
0.70 |
75.0 |
14.6 |
7,955 |
|
122 Nauru |
0.70 |
64.0 |
12.6 |
14,939 |
|
123 Gabon |
0.69 |
65.7 |
12.4 |
11,194 |
|
124 Suriname |
0.69 |
70.3 |
11.0 |
12,310 |
|
125 Bhutan |
0.68 |
72.2 |
13.1 |
10,625 |
|
126 Tajikistan |
0.68 |
71.3 |
10.9 |
4,807 |
|
127 El Salvador |
0.67 |
71.5 |
11.9 |
8,886 |
|
128 Iraq |
0.67 |
71.3 |
12.2 |
9,092 |
|
129 Bangladesh |
0.67 |
73.7 |
11.9 |
6,511 |
|
130 Nicaragua |
0.67 |
74.6 |
12.6 |
5,427 |
|
131 Cabo Verde |
0.66 |
74.7 |
11.5 |
7,601 |
|
132 Tuvalu |
0.65 |
64.9 |
12.1 |
4,754 |
|
133 Equatorial Guinea |
0.65 |
61.2 |
12.1 |
10,663 |
|
134 India |
0.64 |
67.7 |
12.6 |
6,951 |
|
135 Micronesia |
0.63 |
70.9 |
12.6 |
3,709 |
|
136 Guatemala |
0.63 |
68.7 |
10.8 |
8,996 |
|
137 Kiribati |
0.63 |
67.7 |
11.8 |
3,440 |
|
138 Honduras |
0.62 |
70.7 |
10.0 |
5,272 |
|
139 Laos |
0.62 |
69.0 |
10.2 |
7,745 |
|
140 Vanuatu |
0.61 |
70.5 |
11.8 |
3,244 |
|
141 Sao Tome and Principe |
0.61 |
68.8 |
12.7 |
4,054 |
|
142 Eswatini |
0.61 |
56.4 |
14.9 |
8,392 |
|
142 Namibia |
0.61 |
58.1 |
11.8 |
9,200 |
|
144 Myanmar |
0.61 |
67.3 |
12.1 |
4,038 |
|
145 Ghana |
0.60 |
63.9 |
11.6 |
5,380 |
|
146 Kenya |
0.60 |
62.1 |
11.4 |
4,808 |
|
146 Nepal |
0.60 |
70.5 |
12.6 |
4,026 |
|
148 Cambodia |
0.60 |
69.9 |
11.6 |
4,291 |
|
149 Congo-Brazzaville |
0.59 |
63.1 |
12.4 |
2,903 |
|
150 Angola |
0.59 |
61.9 |
12.2 |
5,328 |
|
151 Cameroon |
0.59 |
61.0 |
13.4 |
3,681 |
|
152 Comoros |
0.59 |
63.7 |
13.0 |
3,261 |
|
153 Zambia |
0.57 |
61.8 |
11.0 |
3,157 |
|
154 Papua New Guinea |
0.57 |
66.0 |
11.1 |
3,710 |
|
155 Timor-Leste |
0.57 |
69.1 |
13.2 |
1,629 |
|
156 Solomon Islands |
0.56 |
70.7 |
10.3 |
2,273 |
|
157 Syria |
0.56 |
72.3 |
7.4 |
3,594 |
|
158 Haiti |
0.55 |
63.7 |
11.1 |
2,802 |
|
159 Uganda |
0.55 |
63.6 |
11.5 |
2,241 |
|
159 Zimbabwe |
0.55 |
59.4 |
11.0 |
2,079 |
|
161 Nigeria |
0.55 |
53.6 |
10.5 |
4,755 |
|
161 Rwanda |
0.55 |
67.1 |
11.4 |
2,317 |
|
163 Togo |
0.55 |
61.6 |
13.0 |
2,214 |
|
164 Mauritania |
0.54 |
64.7 |
8.1 |
5,344 |
|
164 Pakistan |
0.54 |
66.4 |
7.9 |
5,374 |
|
166 Côte d'Ivoire |
0.53 |
58.9 |
10.1 |
5,376 |
|
167 Tanzania |
0.53 |
66.8 |
8.6 |
2,578 |
|
168 Lesotho |
0.52 |
53.0 |
11.1 |
2,709 |
|
169 Senegal |
0.52 |
67.9 |
9.1 |
3,464 |
|
170 Sudan |
0.52 |
65.6 |
8.5 |
3,515 |
|
171 Djibouti |
0.52 |
62.9 |
8.0 |
4,875 |
|
172 Malawi |
0.51 |
62.9 |
11.5 |
1,432 |
|
173 Benin |
0.50 |
60.0 |
10.3 |
3,406 |
|
174 Gambia |
0.49 |
62.9 |
9.0 |
2,090 |
|
175 Eritrea |
0.49 |
66.6 |
7.3 |
1,957 |
|
176 Ethiopia |
0.49 |
65.6 |
9.9 |
2,369 |
|
177 Liberia |
0.49 |
61.1 |
10.5 |
1,330 |
|
177 Madagascar |
0.49 |
65.2 |
9.2 |
1,464 |
|
179 Guinea-Bissau |
0.48 |
59.9 |
10.5 |
1,880 |
|
180 Congo |
0.48 |
59.7 |
9.6 |
1,080 |
|
181 Guinea |
0.47 |
59.0 |
10.2 |
2,404 |
|
182 Afghanistan |
0.46 |
62.9 |
10.7 |
1,335 |
|
183 Mozambique |
0.46 |
59.6 |
10.7 |
1,219 |
|
184 Sierra Leone |
0.46 |
60.4 |
9.0 |
1,613 |
|
185 Burkina Faso |
0.44 |
59.8 |
8.1 |
2,037 |
|
186 Yemen |
0.42 |
63.7 |
7.9 |
1,106 |
|
187 Burundi |
0.42 |
62.0 |
10.0 |
712 |
|
188 Mali |
0.41 |
59.4 |
7.0 |
2,044 |
|
189 Chad |
0.39 |
53.0 |
8.2 |
1,389 |
|
189 Niger |
0.39 |
62.1 |
7.2 |
1,283 |
|
191 Central African Republic |
0.39 |
54.5 |
7.3 |
869 |
|
192 South Sudan |
0.38 |
55.6 |
5.6 |
691 |
|
193 Somalia |
0.38 |
56.1 |
7.6 |
1,072 |
Switzerland topped the charts for a second consecutive year. Its overall score is boosted by high incomes and long life expectancies. Other countries in western Europe have some of the highest scores. Some parts of Asia also do well, with Hong Kong and Singapore making it to the top ten. Elsewhere it is bleaker: countries such as Peru, Colombia, Libya and Lebanon have made little progress since 2019. Living standards in Ukraine and Russia have also dropped: the countries fell by 23 and four places respectively between 2021 and 2022. War-torn Yemen, poor and indebted Belize, and Micronesia, an island country at risk of being swallowed by rising sea levels, all peaked in 2010 and have declined every year since.
The index is a useful, but incomplete, measure. It does not account for economic inequality, for example, or disparities between ethnicities and genders. (The UN now produces separate indices that include some of these measures.)
But it does provide a consistent measure for policymakers and ngo’s. Its regional projections for 2023 show that living standards are set to rise further still; only the Arab world will not have fully rebounded to its score in 2019. Nevertheless the long-term trend appears to have suffered a permanent setback since the pandemic (see chart 1). The value for 2022 and projection for 2023 suggests that development may be stuck on a course below the pre-2019 trend, which had held strong since 1999.
This setback will affect the world’s poorest the hardest. Across the oecd, a club of rich countries, hdi values have recovered to or surpassed pre-pandemic levels. But that is true for less than half of the world’s least-developed countries. For 20 years the gap between countries with the highest and lowest hdi values had narrowed (except for a brief period around the financial crash of 2007-09). But since 2020 it has widened.
Yet there are reasons for hope. The chaos of the 2020s has also shown that governments can collaborate on some big issues. During the pandemic, vaccines were developed, produced and distributed at remarkable speed, saving an estimated 20m lives in their first year alone. At cop28 last year the world proved that it could agree on a deal to tackle climate change (even if fulfilling it is another matter). More of that will be needed to overcome the setbacks from the start of the decade.
Source: WUNRN – 21.04.2024